Heart Rate Variability (HRV) for Athletes: The Complete Beginner's Guide
 By Marina, Astrea co-founder Substack
The first time I saw my HRV number in the Apple Health app, I read the description Apple gives you right there on the screen, and I still didn’t get it. It went up some days, down on others, and everyone online agreed that “higher is better” without ever explaining why in a way that actually clicked for me. If you’ve stared at that same number feeling a little lost, this is the explanation I wish someone had given me first.
Quick digest
- HRV measures how much the tiny time gaps between your heartbeats change from one beat to the next, not how fast your heart beats (Shaffer & Ginsberg, 2017).
- A higher HRV usually means your body can shift smoothly between stress and recovery. A lower HRV usually means it’s stuck more in “alert” mode.
- Hard training temporarily lowers HRV; what matters is how quickly it bounces back afterward (Stanley et al., 2013).
- Comparing your HRV number to someone else’s tells you very little. Comparing today’s number to your own recent baseline tells you a lot (Plews et al., 2013).
- Sleep, alcohol, stress, illness, and hormonal cycles all move your HRV too, not just workouts.
What HRV actually measures
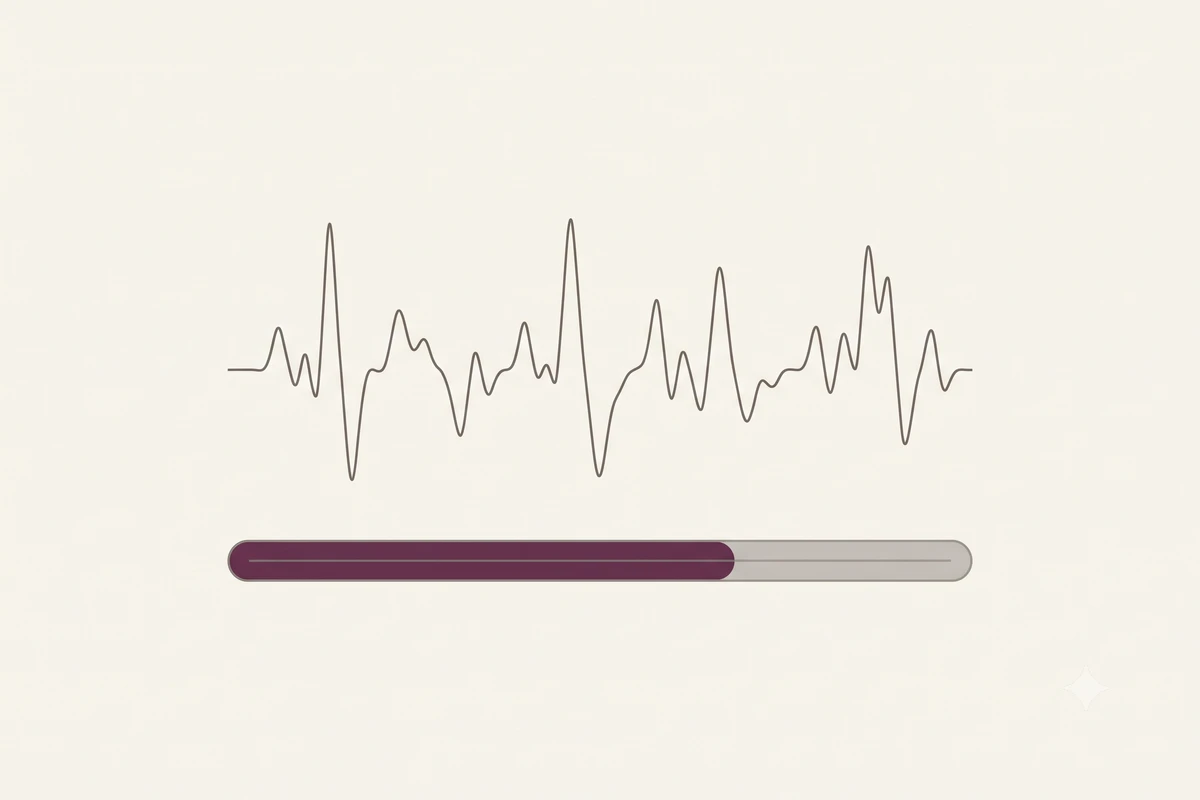
Your heart doesn’t beat like a metronome. Even at a steady resting heart rate, the exact time between each beat varies slightly: one gap might be 0.98 seconds, the next 1.05, the next 0.99. Heart rate variability is simply a measurement of how much that gap changes, beat to beat (Shaffer & Ginsberg, 2017).
Low variability means those gaps stay almost identical every time. High variability means they bounce around more. That’s the whole concept. HRV isn’t about speed; it’s about the consistency of the timing between beats.
Why a higher number is considered good
This is the part that confused me most, so here’s the simplest version I’ve found.
Your heart rate is controlled by two branches of your nervous system working like a gas pedal and a brake. The sympathetic branch speeds things up and prepares you for action: stress, exercise, a sudden scare. The parasympathetic branch, largely carried through the vagus nerve, slows things down and supports rest, digestion, and recovery (Task Force of the European Society of Cardiology and the North American Society of Pacing and Electrophysiology, 1996).
A higher HRV generally reflects a strong, responsive “brake”: a nervous system that can shift smoothly between alert and calm as conditions change. A lower HRV often means the brake is less available, so the timing between heartbeats stays more rigid. That can happen for plenty of ordinary reasons: stress, poor sleep, dehydration, illness, or accumulated training fatigue (Shaffer & Ginsberg, 2017).
Picture a car’s suspension. A good one makes constant small adjustments to absorb bumps smoothly. A worn-out one is stiffer and transmits every bump straight to the frame. High HRV is the smooth suspension; low HRV is the stiff one. It’s worth saying plainly: HRV isn’t a fitness score by itself, and chasing a higher number every single day isn’t the goal. It’s a signal of recovery and readiness, not a grade.
How athletes actually use it
Hard training is a form of controlled stress. It temporarily pushes the sympathetic system into overdrive, and HRV typically dips afterward, that part is expected. What matters is the recovery curve: how quickly the number returns to baseline (Stanley et al., 2013).
Endurance athletes who adjusted their training based on daily HRV readings, training hard on days their HRV had recovered and backing off on days it hadn’t, showed larger fitness gains over several weeks than athletes following a fixed schedule regardless of their numbers (Kiviniemi et al., 2007). That’s the practical case for tracking it: not as a mood ring, but as an early, objective input alongside how you actually feel.
HRV also varies with the menstrual cycle, tending to run lower during the luteal phase than the follicular phase (Schmalenberger et al., 2019). That’s a hormonal pattern, not a red flag, and it’s a big part of why comparing your own cycle-aware trend matters more than comparing to a single fixed number.
It helps to see how wide population benchmarks actually are, which is exactly why an “average” label on a wearable doesn’t mean much. A review pooling short-term data on RMSSD (root mean square of successive differences, a measure of moment-to-moment beat timing) from over 21,000 healthy adults across 44 studies found a median of about 37 ms, with most people landing somewhere between roughly 19 and 75 ms, a huge spread even among people with nothing wrong (Nunan et al., 2010). RMSSD also declines substantially with age, dropping to roughly half its younger-adult level by your sixties, though the sex gap in this particular metric closes by around age 30 (Umetani et al., 1998). A number built from a population that broad tells you far less than your own week-to-week trend does.
Training isn’t the only thing moving your number, either. Sleep debt, dehydration, illness, high emotional or work stress, and alcohol all add load to the same nervous system that training does, and each one can suppress HRV on its own, even on a day you didn’t train hard at all. That’s useful information: a low reading on a rest day is worth a look at the rest of your life, not just your training log.
A concrete way to picture the recovery curve: say your baseline RMSSD normally sits around 65. After an easy week, a hard interval session might dip it to 55 the next morning, and by day three it’s back near 65, a normal load-and-recover pattern. If a similarly hard session instead drops it to 40 and it’s still sitting at 45 four days later, that slower rebound is the signal worth paying attention to, more than the size of the initial dip (Plews et al., 2013).
How to actually measure it
HRV shifts throughout the day based on posture, digestion, and activity, so consistency matters more than any single device. The most reliable reading comes first thing in the morning, right after waking, while still lying down (Task Force of the European Society of Cardiology and the North American Society of Pacing and Electrophysiology, 1996).
A few common options, roughly in order of convenience:
- Smart rings and watches (Oura, Whoop, Garmin, Apple Watch): measure passively overnight and surface a daily score automatically. The easiest starting point for most beginners.
- Chest strap monitors paired with an HRV app: often more accurate than wrist sensors, but need a short, dedicated reading, usually a few minutes, first thing in the morning.
- Phone camera apps: use your camera and flash against a fingertip to estimate variability. Convenient and free, generally the least precise of the three.
Most wearables surface RMSSD, the standard short-term metric most closely tied to parasympathetic activity, and calculate it automatically; you don’t need to run the math yourself (Shaffer & Ginsberg, 2017). A second metric, SDNN (standard deviation of NN intervals, meaning the normal beat-to-beat intervals), looks at variability over a longer stretch of time and reflects a broader mix of nervous system influences; some platforms show it alongside RMSSD. Pick whichever device you’ll actually wear every day. A slightly less precise reading taken consistently beats a precise one taken occasionally.
What to actually do with your number
- Measure at the same time and position each day, ideally right after waking, before coffee or checking your phone. Consistency matters more than the device.
- Build your baseline over two to three weeks before drawing conclusions. A single day’s reading, on its own, tells you almost nothing.
- Watch the trend and the recovery speed, not any one morning. A dip after a hard session is expected; several low readings in a row is worth noticing.
- Read it alongside sleep, resting heart rate, and how you feel. HRV is one input, not the whole picture.
- When your number sits well below baseline for multiple days, treat it as a nudge toward an easier session or extra sleep, not as a verdict on your training.
FAQ
Should my HRV go up every single day if I’m doing everything right? No. Day-to-day wobble is normal even for well-rested, healthy people. It’s the sustained trend and how quickly you recover after hard efforts that carries the real signal, not any one morning’s reading.
Is a higher HRV than my training partner’s a sign I’m fitter? Not necessarily. HRV is shaped by genetics, age, and individual physiology, so your absolute number and someone else’s aren’t directly comparable. Your own trend against your own baseline is what matters (Plews et al., 2013).
If my HRV is low, should I skip training? Not automatically. A single low reading after a hard session, a rough night, or a stressful day is expected. It’s a pattern of consistently low readings, especially alongside poor sleep or lingering soreness, that’s worth acting on.
Does alcohol really affect it that much? Yes, HRV commonly drops the night you drink and can stay suppressed the following night too, since it adds another load for your nervous system to recover from on top of training.
What do RMSSD and SDNN actually mean, and which one should I watch? RMSSD (root mean square of successive differences) measures how much the timing between consecutive heartbeats changes from one beat to the next, over a short window, usually a few minutes. It’s closely tied to parasympathetic, rest-and-recover activity. SDNN (standard deviation of NN intervals, the normal beat-to-beat intervals) measures variability over a longer stretch and captures a broader mix of nervous system influences. Most wearables default to RMSSD, and for day-to-day training decisions, its trend is the more common and practical one to follow.
Sources
Kiviniemi, A. M., Hautala, A. J., Kinnunen, H., & Tulppo, M. P. (2007). Endurance training guided individually by daily heart rate variability measurements. European Journal of Applied Physiology, 101(6), 743-751. https://doi.org/10.1007/s00421-007-0552-2
Nunan, D., Sandercock, G. R. H., & Brodie, D. A. (2010). A quantitative systematic review of normal values for short-term heart rate variability in healthy adults. Pacing and Clinical Electrophysiology, 33(11), 1407-1417. https://doi.org/10.1111/j.1540-8159.2010.02841.x
Plews, D. J., Laursen, P. B., Stanley, J., Kilding, A. E., & Buchheit, M. (2013). Training adaptation and heart rate variability in elite endurance athletes: Opening the door to effective monitoring. Sports Medicine, 43(9), 773-781. https://doi.org/10.1007/s40279-013-0071-8
Schmalenberger, K. M., Eisenlohr-Moul, T. A., Würth, L., Schneider, E., Thayer, J. F., Ditzen, B., & Jarczok, M. N. (2019). A systematic review and meta-analysis of within-person changes in cardiac vagal activity across the menstrual cycle: Implications for female health and future studies. Journal of Clinical Medicine, 8(11), Article 1946. https://doi.org/10.3390/jcm8111946
Shaffer, F., & Ginsberg, J. P. (2017). An overview of heart rate variability metrics and norms. Frontiers in Public Health, 5, Article 258. https://doi.org/10.3389/fpubh.2017.00258
Stanley, J., Peake, J. M., & Buchheit, M. (2013). Cardiac parasympathetic reactivation following exercise: Implications for training prescription. Sports Medicine, 43(12), 1259-1277. https://doi.org/10.1007/s40279-013-0083-4
Task Force of the European Society of Cardiology and the North American Society of Pacing and Electrophysiology. (1996). Heart rate variability: Standards of measurement, physiological interpretation, and clinical use. Circulation, 93(5), 1043-1065. https://doi.org/10.1161/01.CIR.93.5.1043
Umetani, K., Singer, D. H., McCraty, R., & Atkinson, M. (1998). Twenty-four hour time domain heart rate variability and heart rate: Relations to age and gender over nine decades. Journal of the American College of Cardiology, 31(3), 593-601. https://doi.org/10.1016/S0735-1097(97)00554-8
A note from us We’re Martin and Marina, Astrea’s co-founders. We’re both into data and serious about our own training, but neither of us is a doctor or a clinical researcher. The health and physiology claims in this article come from published, peer-reviewed research, not our own expertise, which is why every article ends with a Sources list above. If a claim doesn’t trace back to a real source, we cut it before it gets published.
Astrea reads your HRV and recovery against your own baseline, not a population average — so a low morning number means what it actually means for you.