Acute vs Chronic Workload Ratio (ACWR) Explained: How to Avoid Overtraining
 By Martin, Astrea co-founder
A while back I decided to close all my Apple Watch rings, every single day, for 30 days straight, which meant running most days whether or not it actually made sense with everything else going on that month. I hit the streak. I also came out the other side of it run down in a way that took longer to shake than the 30 days had taken to build. What I’d actually done was stack a month of extra load onto a base that hadn’t caught up to it yet, and that gap between doing more and paying for it later is exactly what the acute:chronic workload ratio was built to catch.
Quick digest
- Your “acute” load is roughly your last 7 days of training; your “chronic” load is roughly your last 28 days. Divide one by the other and you get the acute:chronic workload ratio (ACWR).
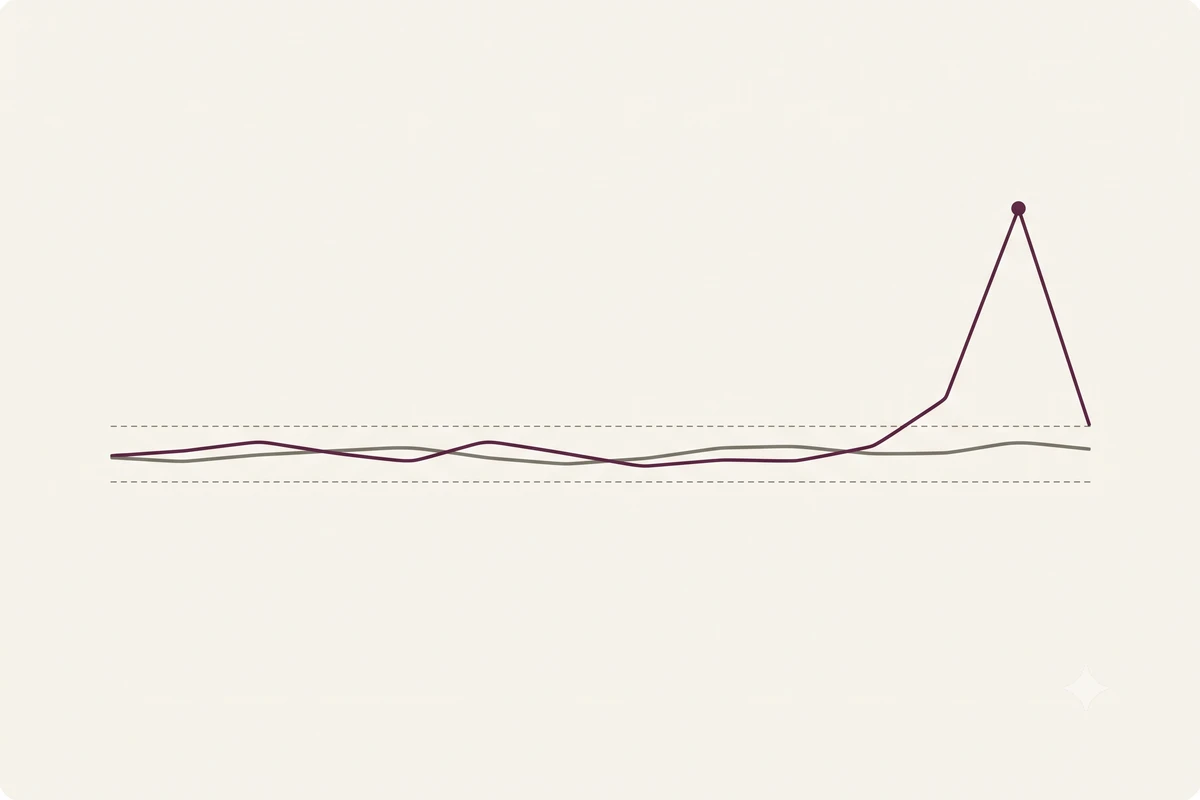
- In elite rugby league players, injury risk climbed sharply once a week’s load ran about 50% above the athlete’s own one-month average, an ACWR of 1.5 or higher (Hulin et al., 2016).
- The lowest-risk range sits close to even, roughly 0.8 to 1.3, meaning a normal week looks a lot like the month before it, not deliberately reduced (Gabbett, 2016).
- A high number isn’t only about a hard week. It can also mean your chronic average was too low to begin with, often after time off, so the same week now reads as a much bigger jump.
- The ratio is a screening tool, not a verdict. Researchers have identified real statistical problems with how it’s usually calculated, so treat a spike as a prompt to look closer, not a diagnosis (Lolli et al., 2019; Impellizzeri et al., 2020).
- For menstruating women, the same jump in weekly training can land differently depending on cycle phase: one study found muscle and tendon injuries nearly doubled in the days just before ovulation compared to other phases (Martin et al., 2021).
What the ratio is actually comparing
“Load” sounds technical, but it’s usually built from something simple: how hard a session felt, multiplied by how long it lasted. This is the session-RPE method, RPE standing for rate of perceived exertion, usually rated on a simple 1–10 scale for how hard something felt, and it correlates closely enough with objective measures of training stress that coaches use it on its own, without any hardware, to monitor athletes (Foster et al., 2001). If you run, load might be weekly distance or time. If you lift, it might be sets multiplied by perceived effort. The exact unit matters less than using the same one consistently, week over week.
Acute load is your recent training, almost always the last 7 days. Chronic load is your established baseline, almost always a rolling 4-week average. The ratio is just one divided by the other: ACWR = acute load ÷ chronic load. A ratio of 1.0 means this week looked like an average week from the past month. A ratio of 2.0 means you doubled it.
Picture a runner who’s been averaging 20 miles (32 km) a week for a month, then runs 35 miles (56 km) in one week because the weather was good and a race is coming up:
| Weekly distance | |
|---|---|
| Chronic load (4-week average) | 20 miles (32 km) |
| Acute load (this week) | 35 miles (56 km) |
| ACWR | 35 ÷ 20 = 1.75 |
That’s a real jump relative to what the body has actually adapted to, even though 35 miles isn’t an unusual weekly total for a fit runner in isolation. The number isn’t about the absolute workload, but rather about how that workload compares to what you’ve actually been doing.
The same logic applies to lifting, cycling, or any sport: a program’s “peak week” that crams in more sets, more distance, or more intensity than the month before it is the same kind of jump, just measured in different units. The window lengths aren’t arbitrary, either: 7 days smooths out the natural difference between a hard day and an easy day, and 28 days is roughly how long measurable fitness adaptations, like increased tendon stiffness, take to show up from a given training stimulus.
The sweet spot, and why more chronic load can mean less risk
The intuitive assumption is that harder training causes more injuries, full stop. Gabbett’s 2016 research complicated that story in a useful way: high training loads alone didn’t predict injury. What predicted injury was a training load that spiked well above an athlete’s own established base, while a high chronic load built up gradually actually seemed to protect against injury, likely because it develops the physical capacity (stronger tendons, better conditioning) that the body needs to tolerate hard weeks (Gabbett, 2016). He called it the training-injury prevention paradox: the same weekly load that’s dangerous for an unprepared athlete can be safely absorbed by one whose base was built up properly first.
In elite rugby league players, that pattern showed up as a specific range. When acute load stayed close to chronic load, between roughly 0.8 and 1.3, injury risk stayed low. Once acute load reached about 1.5 times chronic load, injury risk rose sharply (Hulin et al., 2016). That 0.8–1.3 band is the “sweet spot” you’ll see referenced in sport science writing. Notice what it doesn’t mean: it doesn’t mean training less. It means letting your base catch up before your peak weeks ask more of it.
One methodological refinement worth knowing: the original ratio used a simple rolling average, which treats a training session from three weeks ago as equally important as one from yesterday. Williams and colleagues proposed weighting recent days more heavily using an exponentially weighted moving average, which turned out to track injury likelihood more sensitively than the simple version (Williams et al., 2017). If you’ve seen ACWR calculated two different ways in different apps, this is usually why.
That’s worth sitting with, because it explains why “just do less” is the wrong lesson here. Tendons and connective tissue adapt to load slowly, over weeks, not overnight. A gradually built chronic load means those tissues have had time to remodel and get stronger; a sudden spike asks them to absorb a demand they haven’t adapted to yet, regardless of how fit you feel in the moment.
Where the ratio breaks down
None of this makes the ratio a reliable verdict on its own. Statisticians have pointed out that the standard calculation has a built-in problem: the current week’s data appears inside both the acute number and the chronic average it’s compared against, which can produce a correlation with injury that’s partly a statistical artifact (Lolli et al., 2019). Other researchers have argued the ratio only measures training load, not actual mechanical stress on tissue, and that the 7-day and 28-day windows were chosen for convenience rather than derived from how the body adapts (Impellizzeri et al., 2020). Across studies, the relationship between ACWR and injury has also been inconsistent enough that some research finds no meaningful link at all.
None of that means the concept is useless. It means the number works better as one input, alongside sleep, soreness, and how a session actually felt, than as a single gatekeeper deciding whether a week is safe. A ratio nudging past 1.3 is worth a second look, not a canceled session, and the 0.8–1.3 sweet spot itself came from professional team-sport cohorts with years of accumulated conditioning: a reasonable starting reference, not a number carved in stone for every reader.
Where cycle phase fits in
Almost all of the foundational ACWR research, including the rugby league study this article draws on, was done in male team-sport athletes. That’s a real gap, and the same numbers shouldn’t be assumed to apply identically to everyone.
Separate research on female athletes points to something the ratio itself doesn’t capture: injury risk isn’t flat across the menstrual cycle. A four-year study of England’s international women’s football (soccer) team found that muscle and tendon injuries occurred almost twice as often in the late follicular phase (the days leading up to ovulation) compared to the early follicular or luteal phase (Martin et al., 2021). Rising estrogen through this window is associated with looser connective tissue, which plausibly makes the same weekly load land differently depending on timing.
A normal training week still isn’t something to fear. But if you’re eumenorrheic and building this into your planning, hold the ratio a little more loosely: the same jump from one week to the next might warrant more caution in some phases than others, and that kind of context is exactly what a single population-derived number can’t see. Your own trend, tracked against your own cycle, tells you more than a generic threshold borrowed from a rugby league study ever will.
What to actually do
- Track total weekly load in one consistent unit: distance or time for endurance sports, or session-RPE (effort × duration) for strength training or anything without a distance metric. Session-RPE works for lifting just as well as it does for running, since it’s based on perceived effort, not miles covered.
- Use 1.3 to 1.5 as a rough ceiling for how much a single week should exceed your rolling 4-week average, not a hard rule.
- Look at the trend across 3 to 4 weeks rather than reacting to one ratio in isolation.
- Build chronic load up gradually across a training block. A higher base built slowly is what makes hard weeks safer, not just avoiding spikes in isolation.
- Treat a high ratio as a prompt to check in on sleep, soreness, and how sessions actually felt, not as an automatic red light.
- If you’re returning from time off, expect your ratio to look alarming for a few weeks by design. The fix is a gradual re-entry, not distrust of the number.
FAQ
Do I need a GPS watch or power meter to calculate this? No. The session-RPE method, multiplying how hard a session felt (on a simple 1–10 scale) by its duration in minutes, correlates closely enough with objective training load that coaches use it as a standalone monitoring tool (Foster et al., 2001).
Is an ACWR above 1.5 always dangerous? It’s associated with higher injury risk in the team-sport cohorts where this has been studied, not a guarantee of injury for any individual (Hulin et al., 2016). Treat it as a signal worth investigating, not a diagnosis.
Is a lower ratio always safer? No. A very low chronic load, built up too slowly or after a long layoff, leaves you undertrained and can itself raise injury risk once real training resumes (Gabbett, 2016). The goal is a solid, gradually built base, not permanent caution.
I just came back from a break. Does the ratio even make sense right now? It will look inflated by design, since your chronic average dropped while you were out. That’s expected. The move is a slow re-entry over several weeks, letting chronic load rebuild before acute load climbs, rather than reading the number as a crisis.
How is this different from a daily readiness or recovery score? ACWR looks backward at training input over weeks. A readiness score looks at how your body is responding right now, day to day. They answer different questions and work best used together, not as substitutes for each other.
Can I calculate this from Apple Health data? Yes, if you’re logging workouts consistently. The math is simple once you have 4+ weeks of comparable data; the harder part is choosing one consistent load metric and sticking with it.
Sources
Foster, C., Florhaug, J. A., Franklin, J., Gottschall, L., Hrovatin, L. A., Parker, S., Doleshal, P., & Dodge, C. (2001). A new approach to monitoring exercise training. Journal of Strength and Conditioning Research, 15(1), 109-115.
Gabbett, T. J. (2016). The training-injury prevention paradox: should athletes be training smarter and harder? British Journal of Sports Medicine, 50(5), 273-280. https://doi.org/10.1136/bjsports-2015-095788
Hulin, B. T., Gabbett, T. J., Lawson, D. W., Caputi, P., & Sampson, J. A. (2016). The acute:chronic workload ratio predicts injury: high chronic workload may decrease injury risk in elite rugby league players. British Journal of Sports Medicine, 50(4), 231-236. https://doi.org/10.1136/bjsports-2015-094817
Impellizzeri, F. M., Tenan, M. S., Kempton, T., Novak, A., & Coutts, A. J. (2020). Acute:chronic workload ratio: Conceptual issues and fundamental pitfalls. International Journal of Sports Physiology and Performance, 15(6), 907-913.
Lolli, L., Batterham, A. M., Hawkins, R., Kelly, D. M., Strudwick, A. J., Thorpe, R., Gregson, W., & Atkinson, G. (2019). Mathematical coupling causes spurious correlation within the conventional acute-to-chronic workload ratio calculations. British Journal of Sports Medicine, 53(15), 921-922. https://doi.org/10.1136/bjsports-2017-098110
Martin, D., Timmins, K., Cowie, C., Alty, J., Mehta, R., Tang, A., & Varley, I. (2021). Injury incidence across the menstrual cycle in international footballers. Frontiers in Sports and Active Living, 3, Article 616999. https://doi.org/10.3389/fspor.2021.616999
Williams, S., West, S., Cross, M. J., & Stokes, K. A. (2017). Better way to determine the acute:chronic workload ratio? British Journal of Sports Medicine, 51(3), 209-210. https://doi.org/10.1136/bjsports-2016-096589
A note from us We’re Martin and Marina, Astrea’s co-founders. We’re both into data and serious about our own training, but neither of us is a doctor or a clinical researcher. The health and physiology claims in this article come from published, peer-reviewed research, not our own expertise, which is why every article ends with a Sources list above. If a claim doesn’t trace back to a real source, we cut it before it gets published.
Astrea tracks your training load automatically and flags when you’re ramping up too fast — before it turns into an injury.
Related reading · See all Training Load & Periodization